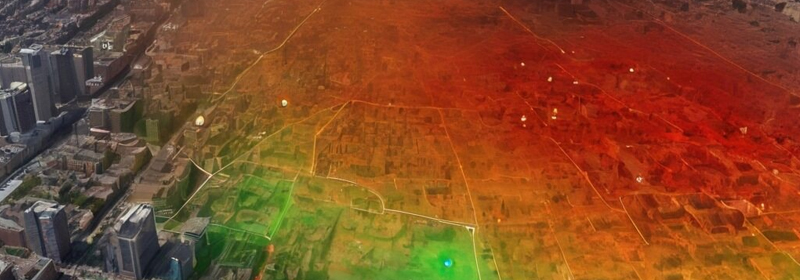
Sasken developed an interactive air quality map that presents real-time air quality levels. Users can adjust the timeframe to observe the progression of air quality from past to future, based on the latest measurements. This dynamic display, animated on the screen, assists users in planning activities such as commuting or choosing jogging routes with consideration to air quality fluctuations.
The customer needed Sasken's assistance in developing the air quality map.
Sasken took full responsibility for software, technologies, design, and specifications for the project. This included tasks such as developing a responsive web application compatible with mobile, tablets, and desktops, complete frontend and backend development, server setup, creating visualizations for air quality data including color schemes and ranges, masking water areas from map overlays using OSM data, and designing a special user interface for metro and tram station information screens.
The customer received a functional map accessible to the public, enabling them to check the air quality across various areas of the city.