

Solution Offering
Technology & Brand Analysis
How good is a product you did not build, and how was it built? We answer both — by measuring it against its competitors, by taking it apart, and by reading the market around it — so investment, IP and product decisions rest on evidence rather than assumption.
Overview
Why choose Sasken for technology and brand analysis?
Almost every competitive question reduces to two: how good is the product, and how was it built. We answer both from our own laboratory rather than from somebody else’s report.
Three methods, used together or on their own — instrumented benchmarking against a class-leading reference, physical teardown and structural analysis, and market and brand positioning assessment.
Key benefits include:
- Findings come from our own instruments and our own bench
- Measurement, teardown and market analysis under one roof
- Every score traceable to the measurement behind it
- Evidence shaped for the decision it has to support
Core Expertise
Core expertise
The same product can be assessed three ways, and the three answer different questions. We run all of them, and say which one a finding came from.
Core competencies include:
- Instrumented competitive benchmarking
- Teardown and structural analysis
- Component decapsulation and microscopy
- Market, brand and competitor positioning
Whether the question is why a competitor performs better, what is inside their product, or where a brand stands in its market, the answer comes back with the evidence attached.
Method
Findings that survive scrutiny
An analysis is only worth having if someone else can check it. Every device in a study is measured on the same rig, in the same conditions, against criteria written down before the work starts.
Results are reported against the measurement they came from, so a conclusion can be re-derived rather than taken on trust.
How we create value:
- Identical conditions across every device in a study
- Criteria defined before measurement, not after
- Objective and subjective results reported separately
- Every finding traceable to its source measurement
Teardown
Teardown and physical analysis
When the question is how a product was built, the answer is inside it. We open it, image it and document what is there — destructively where that is the only way, and non-destructively where it is not.
Specialized expertise includes:
- Multilayer PCB structure analysis — construction, layer count and manufacturing quality
- Component decapsulation — internal structures exposed without damaging silicon or bond wires
- Microscopic examination — materials, coating integrity and micro-defects
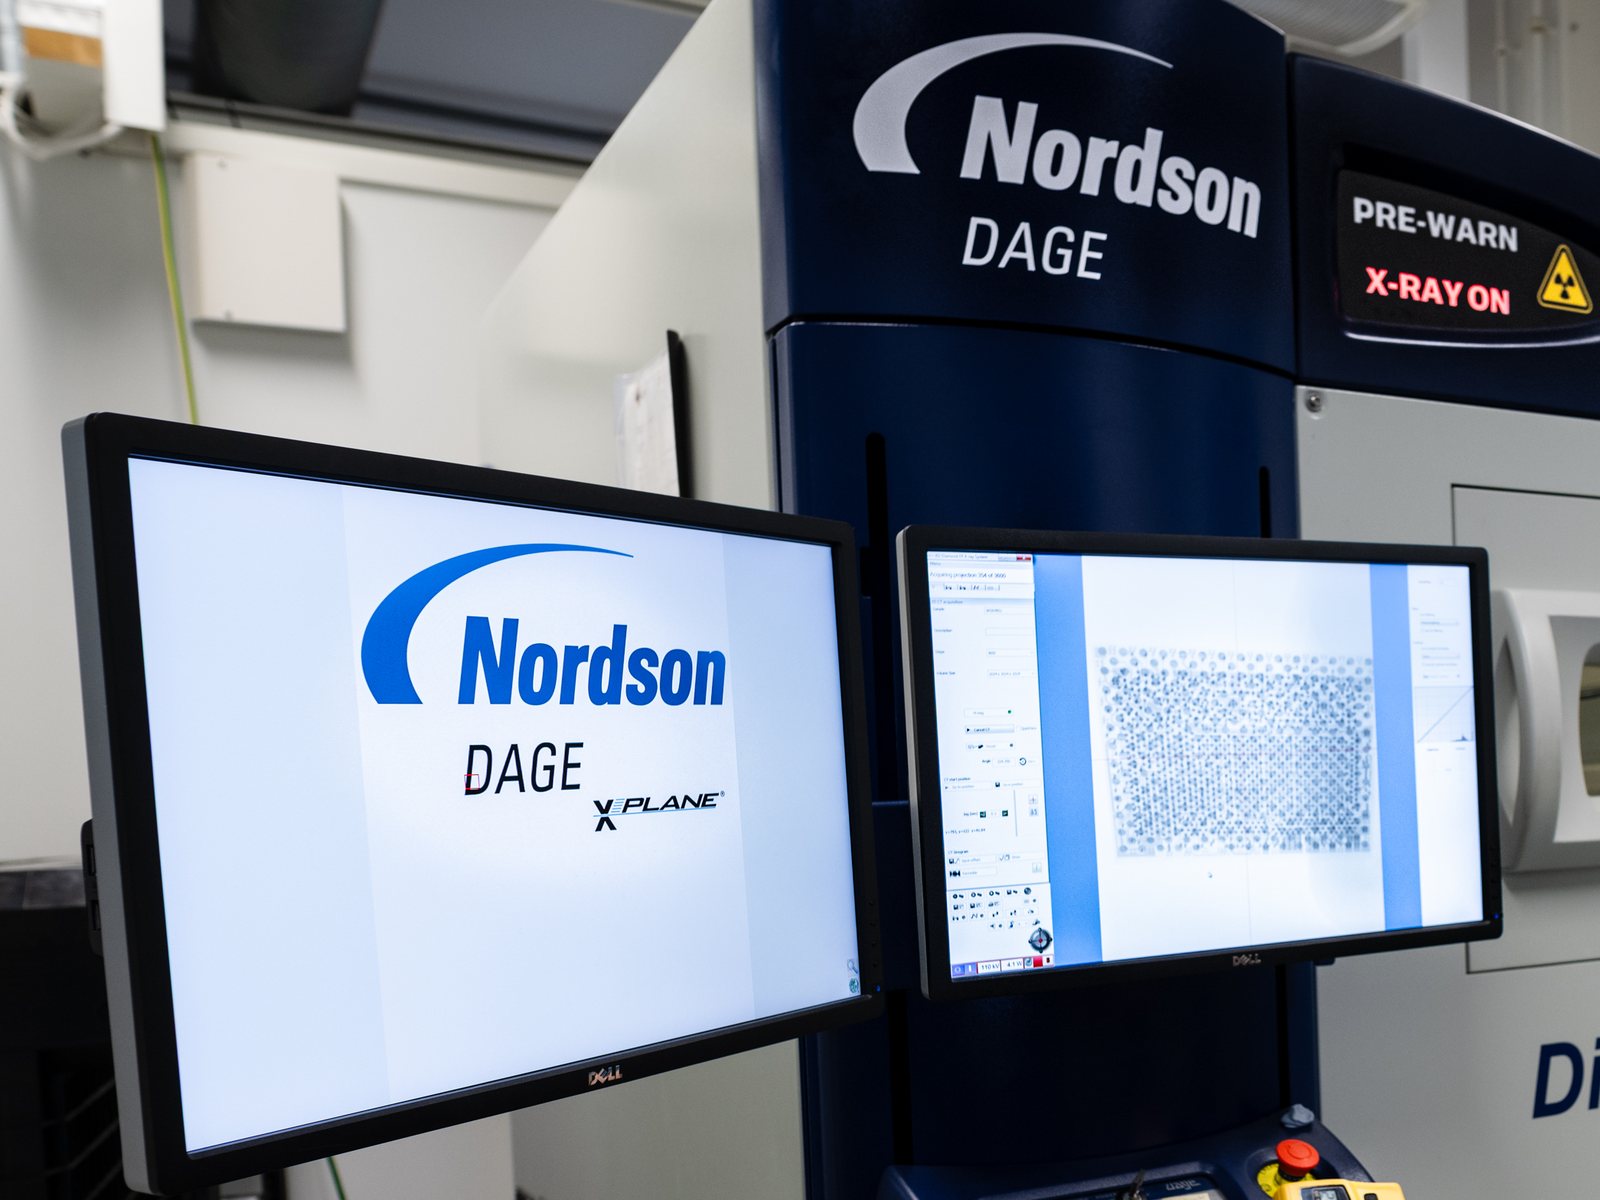
- X-ray and CT imaging — hidden structures, without opening the product
- Thermal imaging and near-field probing — functional assessment where no test interface exists
High-resolution photography and documentation throughout, so the same evidence serves failure analysis, competitive benchmarking, and patent and IP work.
Benchmarking
Competitive benchmarking, measured
A specification tells you whether a product passes. A benchmark tells you where it stands. We measure a product and its competitors on the same rig, in the same conditions, against a class-leading reference device — and report the distance between them.
Scores, not just verdicts
Each measurement’s own specification limit becomes the top score, and the distance beyond it is banded downward. A loudness rating in decibels and a distortion figure in percent become the same kind of number.
That is what makes a ranking possible — and it keeps every score traceable to the measurement and the clause it came from.
Standards measurements
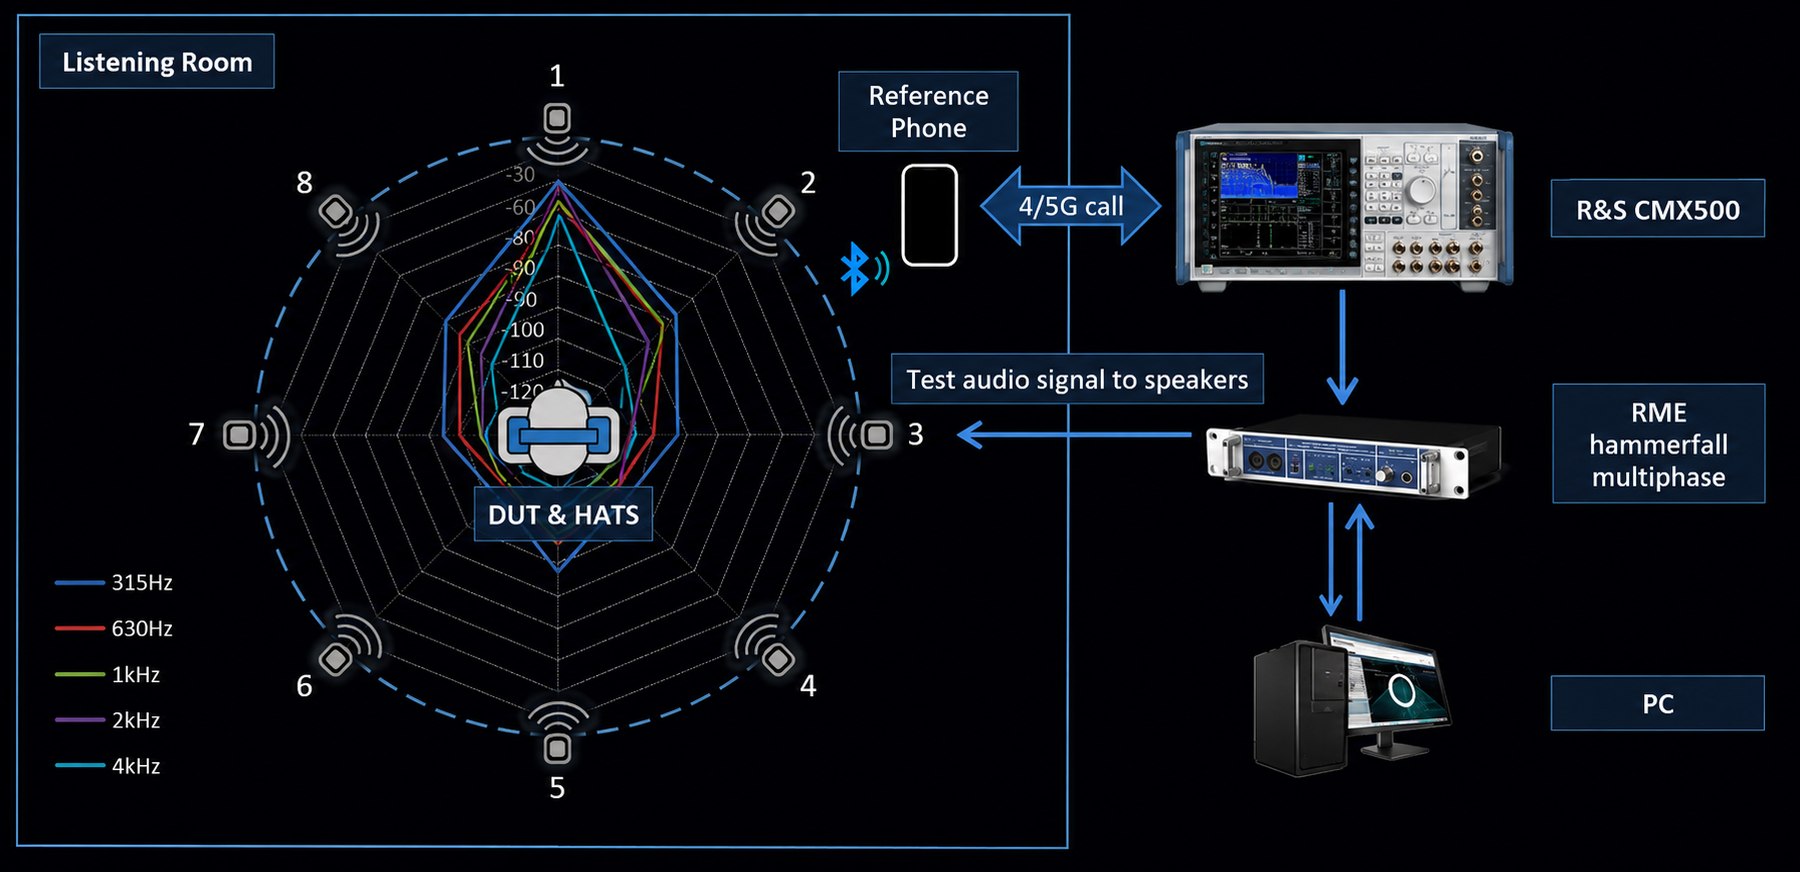
Sending and receiving, to 3GPP TS 26.131 and 26.132: loudness rating, idle channel noise, sensitivity frequency response against its tolerance window, and distortion — with ITU-T P.501 test signals on a head and torso simulator.
Objective quality
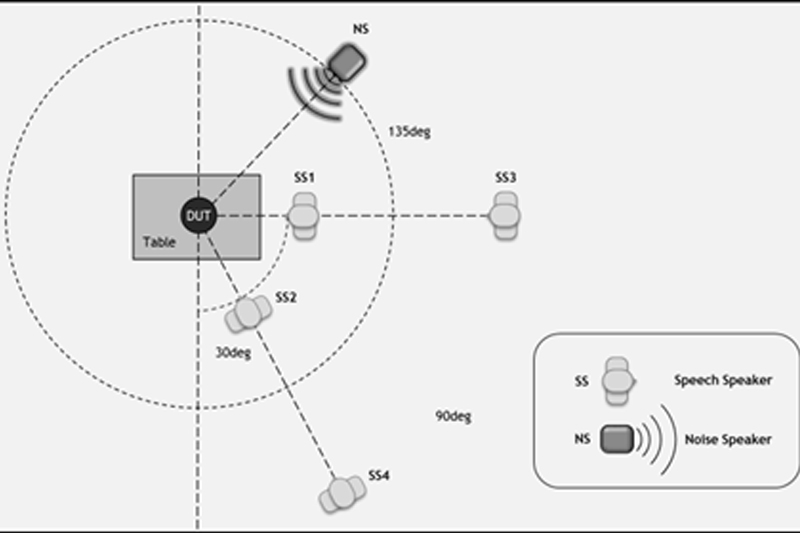
Speech, noise and overall quality scored separately, in quiet and in noise, at nominal and maximum volume — so a device that cleans up noise by damaging the voice is visible as exactly that.
Listening panel
Several listeners scoring the same set: speech in both directions, double talk, echo, touch noise, performance in a noisy room, ergonomics and music playback.
Microphone directivity
An uplink polar pattern answers one question the datasheet rarely does: does the device pick up its user, or the whole room.
Voice assistant
Word accuracy measured in quiet and in noise, because a wake word that works on a desk and fails on a street is a product problem, not a tuning detail.
What you get
A ranking, the per-test breakdown behind it, and the curves and polar plots the scores came from — so every claim can be traced back to a measurement.
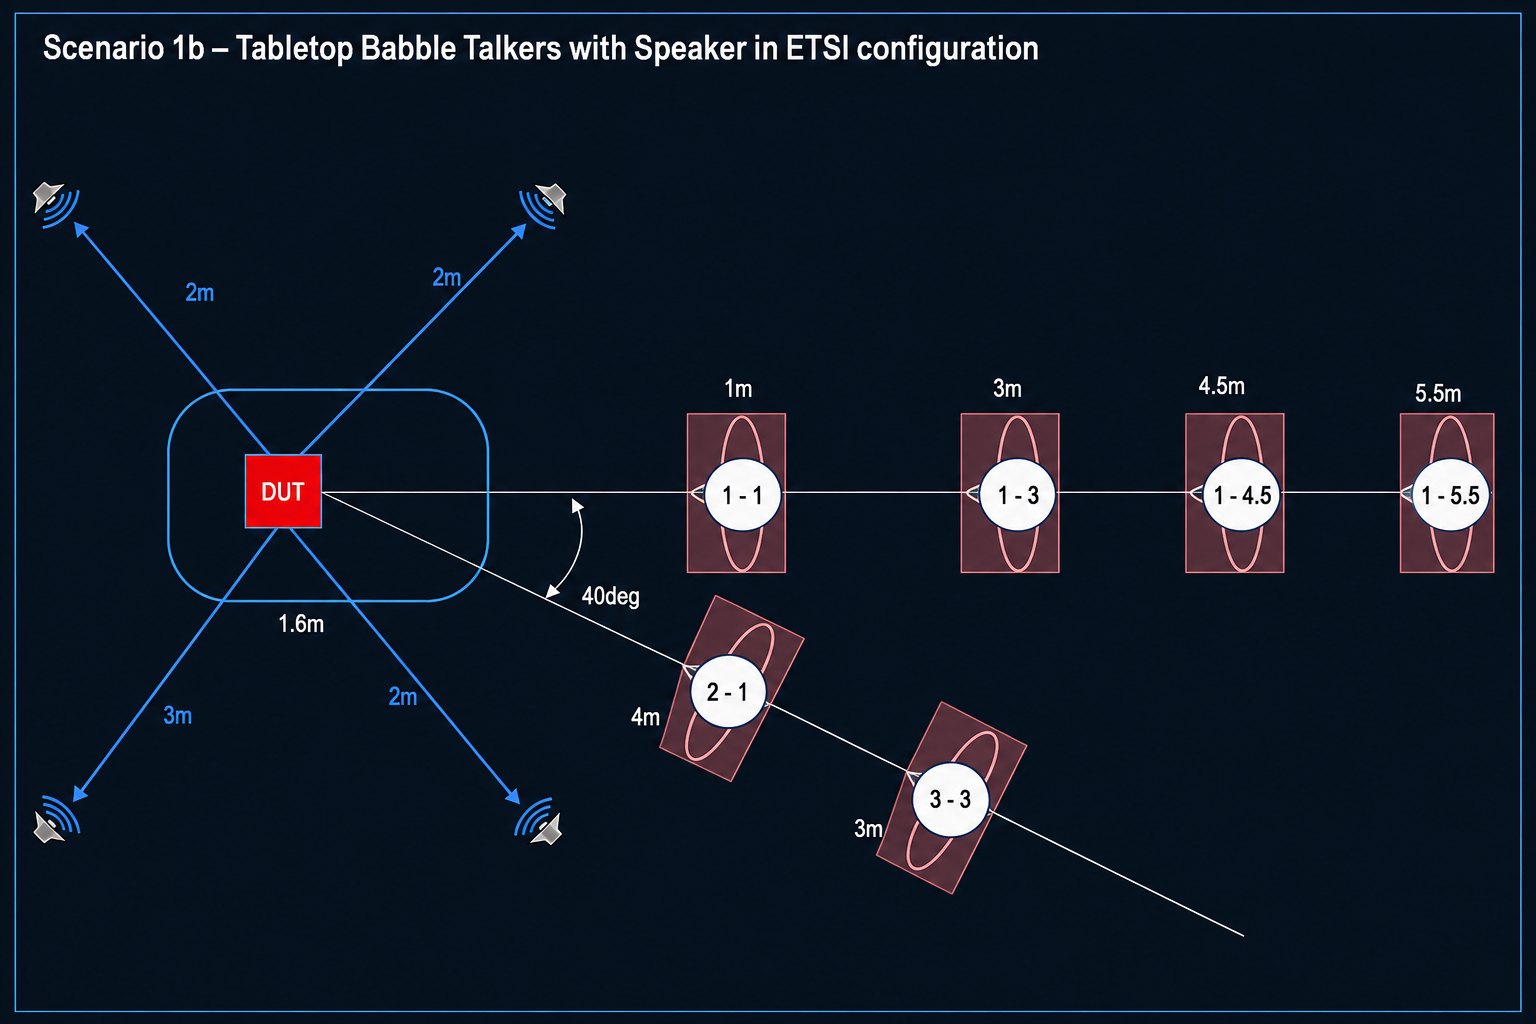
Objective and subjective testing are run and reported separately, on purpose. Instruments and listeners disagree — and where they disagree is usually the finding worth having.

Tools & Tech
Tools and methodologies
The work is done on our own instruments, in our own laboratories in Kaustinen — which is why a finding can be re-checked rather than re-sourced.
Tools and facilities include:
- Nordson Dage XD7600NT X-ray inspection for non-destructive structural analysis
- Optical and electron microscopy with high-resolution photography
- Audio measurement systems, artificial heads, listening room and anechoic chamber
- Thermal imaging and near-field probing
- Scoring and ranking frameworks, with the criteria documented per study
Customer Outcome
Customer outcome
The same study answers different questions depending on who is asking. Customer benefits include:
Because every conclusion carries the measurement behind it, one report holds up in an engineering review and in a licensing negotiation alike.

Have any Business Enquiries?
Got an idea you can't shake? Let's turn it into thriving business together.